How to Use Water Sensitive Paper for Drone Spraying


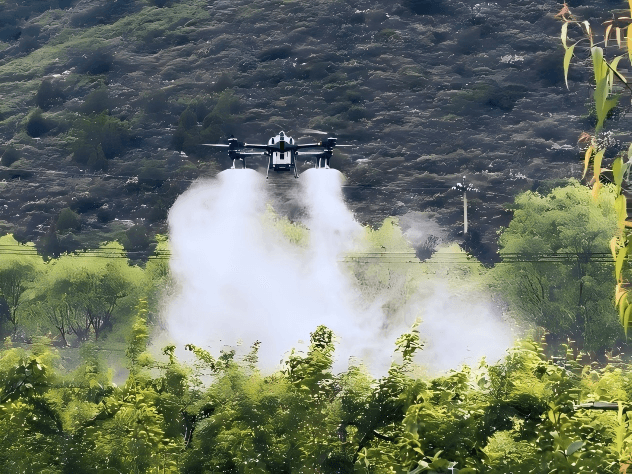
You stand at the edge of the field and watch the spray cloud roll out. It looks even. It looks complete. But from where you’re standing, you can’t see what’s happening inside the canopy or between the passes. The cards can.
Water sensitive paper answers the question your eyes can't: where did the water actually land?
What Is Water Sensitive Paper?
Water sensitive paper, often called WSP, is a coated yellow collector that turns blue where water-based droplets hit. It gives you a visible record of spray distribution. For drone work, use it to compare coverage across the working swath and see how spray reaches different canopy positions.
Look at the whole set rather than the bluest card. A strong center with weak edges points toward a different adjustment than good top coverage with little spray inside the crop.
6 Steps to Use Water Sensitive Paper
Knowing what water sensitive paper shows is one thing. Placing it correctly is where most tests go wrong. Here are six steps to get it right.
1. Prepare the Cards and Test Equipment
Bring fresh cards, dry moisture-resistant gloves, clips or holders, a pencil, a measuring tape, and labeled storage envelopes. Keep unopened cards sealed and store opened packs with desiccant in airtight packaging. Handle cards by the edges; fingerprints can leave marks that look like spray deposits.
Use one brand for the comparison. Paper brands differ in how stains spread, as Syngenta's comparison of water sensitive papers shows. Mixing brands between runs makes it harder to tell whether the spray setting or the collector caused the change.
Write each card's location on its back before placing it. Check a fresh card at the site first. If the background changes color before spraying, wait for drier conditions and check the supports for dew.
2. Place Water Sensitive Paper Across the Swath
For a swath check, arrange evenly spaced cards along a line perpendicular to the flight path. Cover the proposed working width and extend beyond its edges. Measure each card's distance from the centerline so you can connect a weak section to a position in the pattern.
Repeat the layout at several locations along the test area. For example, label three cross-swath lines A, B, and C, then number the cards from left to right. Keep a sketch of the layout. Use the same positions when testing the next setup.
For canopy checks, add cards at the upper, middle, and lower target levels. Keep the yellow face upward to sample overhead deposition. To check underside access, mount a separate card facing downward and label its orientation. Compare equivalent positions across several plants.
Clip the cards to dry supports and leave the sampling face exposed. Secure holders against rotor airflow. Install them shortly before testing, then move the team out of the flight area.
3. Fly a Controlled Water-Only Test
Start with a cleaned spray system and water. Record the flight height above the canopy, speed, route spacing, application volume, nozzle or atomizer setting, and weather. Use your normal operating procedure to check delivered volume.
Test adjacent passes as well as a single pass. The space between flight lines is where overlap problems appear. Purdue Extension's drone calibration guide recommends checking deposition across multiple adjacent passes when establishing an effective swath.
Wait until the aircraft has landed and the pilot has cleared the area before approaching the cards. Let the stains dry fully. Collect lower-canopy cards first so moisture shaken from upper foliage does not splash onto them. Place each card in its matching labeled package.
4. Read the Spray Pattern Before Changing Settings
Lay the cards out in their original order. Check whether the same weak area appears on lines A, B, and C. A repeated pattern deserves attention; one unusual card also calls for a check of its mounting, exposure, and handling.
|
What the cards show |
What to check next |
|
Weak bands between adjacent passes |
Route spacing, overlap, and crosswind displacement |
|
One side repeatedly lighter |
Wind direction, nozzle condition, and output balance |
|
Wet upper cards, sparse lower cards |
Canopy access, height, speed, and application volume |
|
Mostly blue cards with merged stains |
Overlap and volume; individual stains are hard to count |
|
Smears, fingerprints, or a changed background |
Handling and moisture; replace affected cards |
Separate percent coverage from deposit density. Coverage is the share of the analyzed card area that has turned blue. Deposit density is the number of distinct stains per unit area. When stains merge, the count can fall even as the covered area increases.
If upper cards show 12% coverage and lower cards show 3%, investigate the lower target. Combining them into one average hides the difference you need to fix.
5. Scan Water Sensitive Paper for Consistent Comparisons
A visual check is useful for finding gaps. For a closer comparison, digitize the cards and analyze them with spray-card software. The USDA-ARS DepositScan manual uses 600 dpi scans. Calibrate the image scale and compare the same exposed area on every card.
Exclude clips, labels, and damaged edges from the analysis. Inspect the software's detected stains against the original image. Keep scanning and threshold settings consistent across the comparison, and save both the images and the results.
Droplets spread when they hit paper, so stain diameter is larger than the original droplet diameter. Use the paper-specific settings when estimating droplet size.
6. Adjust One Setting and Repeat the Test
Choose the adjustment that matches the pattern. If adjacent passes leave weak strips, review route spacing. If the lower target is sparse, test a supported change to speed, height, or volume. Keep the other selected settings unchanged and use fresh cards in the same positions.
Recheck delivered volume after changes to speed or route spacing. After selecting a better pattern, confirm the intended formulation through the appropriate application check; additives can change wetting and distribution. Use label-required protection and access procedures when collecting pesticide-exposed cards.
Keep a simple run sheet beside the card map. Give each run an ID, list the setting you changed, and note whether the rate controller changed pump output. If wind direction shifts between runs, record that too. Keep the best setup with the crop stage and canopy description so the next operator has a useful starting point.
Make Water Sensitive Paper Part of Your Routine
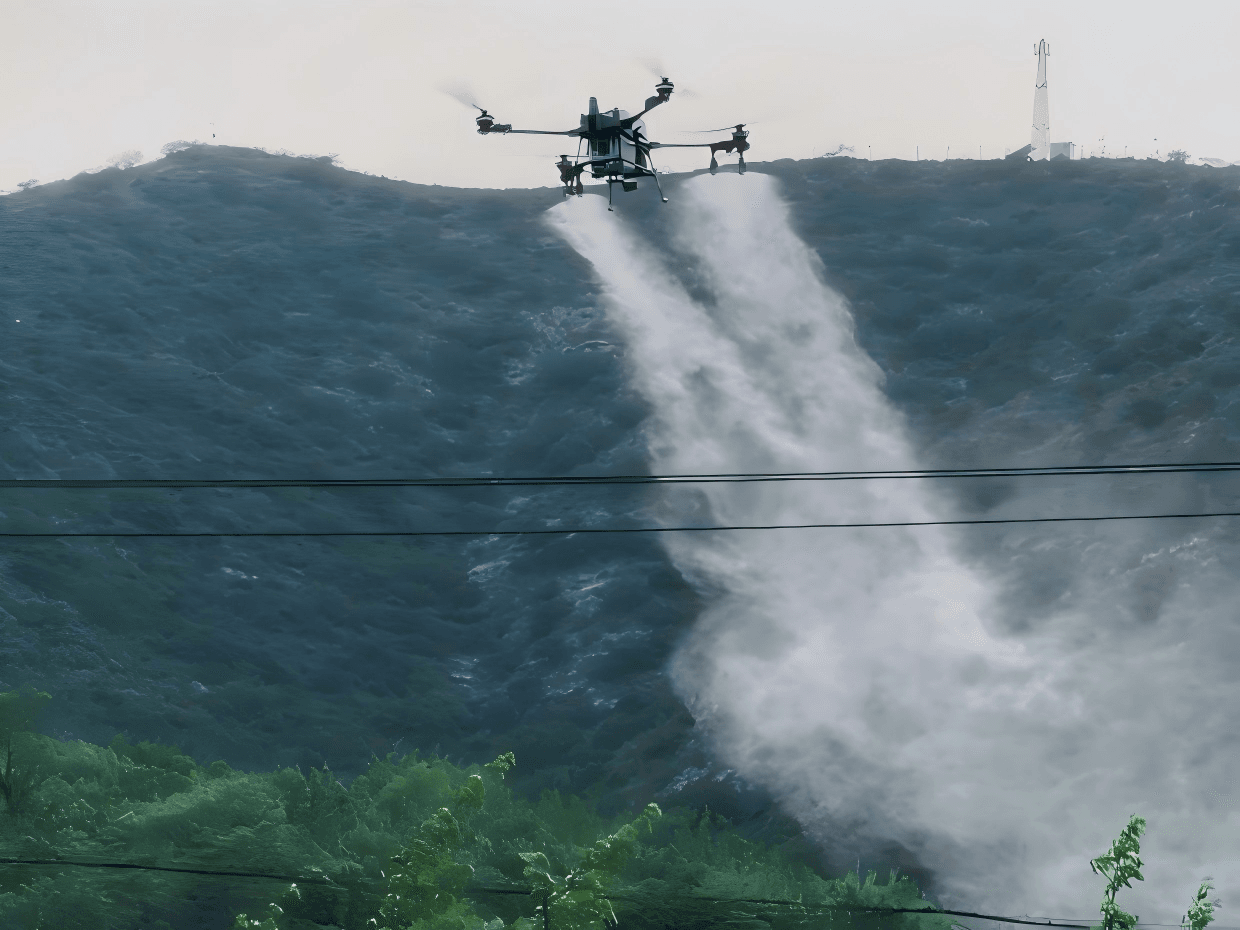
A spray check only pays off when the cards are placed the same way every time, read against a baseline, and tied to a single adjustment. That is the habit worth building before you worry about which aircraft you fly.
If you want to see how that workflow holds up on an EAVISION platform, bring your card layout and target canopy positions to an agricultural drone demonstration. Compare the results with your current setup, then decide what needs to change.
FAQ
Which side faces the spray?
Expose the yellow, reactive surface toward the direction you want to sample. Use upward-facing cards for overhead deposition and separately labeled downward-facing cards when checking underside access.
Do I need dye in the tank?
No, water-sensitive paper changes color when water lands on it. Dye is used with other collectors, such as plain white paper, when a visible tracer is needed.
Can I reuse water-sensitive paper?
No, the blue reaction is permanent. Use fresh cards for every run so each pattern belongs to one setup.
What coverage percentage should I aim for?
Use the crop and product's application target, then assess each relevant canopy position. Increasing the overall average does not solve a lower-canopy target that remains dry.
How should I store used spray cards?
Let cards dry fully, then store them separately in labeled, dry packaging. Protect them from humidity during transport and analysis.